Discounted Cash Flow Valuation Part 1
Created by David Moore, PhD
Reference Material: Wall Street Prep DCF Modeling Chapter 3 and 5Key Concepts
- Terminal Value
- Perpetuity Growth Rate
- Exit Multiple
- Cost of Capital
- Estimating Weights
- Beta and the Cost of Equity
- Cost of debt
- Enterprise Value
DCF Overview
- Free Cash flows (forecast period)
- Terminal Value
- Discount rate
Infinite Horizon Problem
- Assume a fixed length forecast window
- Followed by terminal window of infinite length
Terminal Value
Terminal 1: Perpetuity Growth Rate
- Growing Perpetuity
- Need a discount rate (r)
- Need a growth rate (g)
Growing Perpetuity
$PV=\frac{C}{r-g}$
Important: Growth rate (g) must be less that interest rate r. If g>r the formula will not work!
Example_1
Given an interest rate of 7 percent per year, what is the value at date t = 8 of a perpetual stream of 500 annual payments that begins at date t = 17 and grows at 5% thereafter? What if the growth rate was 10%?Example_1 Solution
Given an interest rate of 7 percent per year, what is the value at date t = 8 of a perpetual stream of 500 annual payments that begins at date t = 17 and grows at 5% thereafter?$PV_{t=16}=\frac{500}{.07-.05}=25000$
$PV_{t=8}=\frac{25000}{(1+.07)^{16-8}}=14550.23$
What if the growth rate was 10%?
r<g ; cannot solve
Getting the Rates
- r: Use the WACC (more on this later)
- g: A reasonable assumption must be less than the growth rate of overall economy
- Good Assumption: Nominal risk free rate = real Rf rate + expected inflation
- Typical range for g is 2-5%
- 2009-2015 Risk free:2.57% GDP: 3.14%
Terminal 2: Exit Multiple
- Apply valuation multiple to operating metric
- Typical to use comparables Damodaran Website
$Terminal Value= Multiple*Operating Metric$
Example (typical): EBITDA ratio x EBITDA in terminal year.
PV of Terminal Value
- Can be a different discount rate than rate used for terminal window
Issues with Terminal Value Methods
- Perpetuity Growth: Technically sound but requires assumption of when stable growth begins AND stable growth rate.
- Multiples: Makes the valuation a relative (rather than intrinsic) valuation.
Revisit Example 1

Revisit Example 2

Cost of Capital
First Principle of Valuation
Who do unlevered cash flows belong to?Appropriate Discount Rate?
- Free cash flows to the firm discount at cost of capital to the FIRM
- WACC is used as estimate of cost of capital if valuing the entire firm
- Discussed later: Levered cash flows (to equity) use Cost of Equity
What is a Discount rate?
- Incorporate all risk that affect the asset (business)
- Reflect the risk perceived by the marginal investor
- Opportunity cost of taking on risk of investing in the company
- Required return
- Return to investor is the same as cost to the company
Cost of Capital (WACC)
- The firm's assets are financed through debt and equity (RHS of Balance sheet)
- We can use the individual costs of capital for debt and equity to get our "average" cost of capital for the firm
- This "average" is the required return on the firm's assets, based on the market's perception of the risk of those assets
- The weights are determined by how much of each type of financing is used
Cost of Equity
- Who is the equity investor?
- What risks do they face?
- What is their opportunity cost?
Cost of Debt
- Cost of debt is not the coupon rate
- Interested in yield if the firm issued more debt.
- Rate at which you could borrow currently
- Only concerns long-term debt. (Why?)
- Is all debt observable?
Capital Structure Weights
Should we use book or market values?- Notation
- E = market value of equity
- D = market value of debt
- V = market value of the firm = D + E
- Weights
- $w_E = \frac{E}{V} =$ percent financed with equity
- $w_D=\frac{D}{V}=$ percent financed with debt
Taxes
- We are concerned with after-tax cash flows, so we also need to consider the effect of taxes on the various costs of capital
- Interest expense reduces our tax liability
- This reduction in taxes reduces our cost of debt
- Dividends are not tax deductible, so there is no tax impact on the cost of equity
- We use the marginal tax rate
WACC
$WACC=w_ER_E+w_DR_D(1-T_C)$
$w_E$=Weight of Equity
$R_E$=Cost of Equity
$w_D$=Weight of Debt
$R_D$=Cost of Debt
$T_C$=Marginal Corporate Tax rate
Simple Example
The estimated market value of a firm's debt (book value) is 4 million and the market cap is 6 million. The cost of equity is 10% and the cost of debt is 6%. The marginal tax rate is 21%. What is the cost of capital for this firm i.e., What is the WACC?
Answer:7.896%
Estimating Weights
- Equity: Market value of Equity
- Shares outstanding X Share price
- Debt: Market value of debt
- Unobservable...
Estimating Market Value of Debt
- Standard to use Book value of debt
- Only concerned with Long-term Debt!
- Don't forget current portion of LTD
- Also include Notes payable or Lease obligations (any interest bearing long term debt)
- Some Modelers include cash as negative debt (we will not)
Example
What are the market weights for a firm with a share price of $18.5 and 30.5 million shares outstanding. The firm has long-term debt of $385 million and shows $35 million under current portion of long-term debt?Answer: Weight of Equity = 57.33% and Weight of Debt = 42.67%
Estimating Cost of Debt
- Two Methods
- Yield
- Default Spreads
Yield
- Use yield on long-term (10-30 year) straight bonds
- Find yields here
- Major issue is most companies do not offer long term straight bonds that are liquid and widely traded
Default Spreads
- Use the firm rating to estimate the default spread.
- Find default spreads here
- Add default spread to risk free rate
- 10-year rate is most liquid and allows for calculation of default spreads
- Use synthetic rating if firm has bonds with different ratings
- No bond rating? Use interest coverage ratio
Cost of Equity
What makes up a risk adjusted cost of equity?- Risk free rate
- Relative risk of company
- Equity Risk Premium
Market Risk Models
- Capital Asset Pricing Model (CAPM)
- Multi-factor Models (won't be using)
The Capital Asset Pricing Model (CAPM)
$E(R_i)=R_f+\beta_i(E(R_M)-R_f)$
- If we know an asset's systematic risk, we can use the CAPM to determine its expected return
- This is true whether we are talking about financial assets or physical assets
Market Equilibrium
$\frac{E(R_A)-R_f}{\beta_A}=\frac{E(R_M)-R_f}{\beta_M}$
Security Market Line
- The security market line (SML) is the representation of market equilibrium
- The slope of the SML is the reward-to-risk ratio: $\frac{E(R_M)-R_f}{\beta_M}$
- But since the beta for the market is always equal to one, the slope can be rewritten
- Slope $=E(R_M) – R_f =$ market risk premium
Factors Affecting Expected Return
- Pure time value of money: measured by the risk-free rate
- Reward for bearing systematic risk: measured by the market risk premium
- Amount of systematic risk: measured by beta
Simple Example
What is the expected return for a company with a beta of 1.5 if the risk free rate is 3% and the market risk premium is 7%?Answer: 13.5
Risk Free Rate ($R_f$)
Investment must have:
- No default risk
- No reinvestment risk
- Time horizon and zero-coupon
- We will proxy with 10-year Treasury Bond
- Note: Currency matters (if non-USD)
Should you Normalize risk free rate?
NO!- Risk free is alternative investment to stock
Beta
$\beta_{Equity}=\frac{Cov(R_i,R_M)}{Var(R_M)}=\frac{\sigma_{i,M}}{\sigma_M^2}$
, which is equal to the slope from regressing firm returns on market returns
Issues with (Regression) Beta
- High standard error (Remember Statistics!)
- It is backward looking
- It reflects the firm's business mix over the period of the regression, not the current mix
- It reflects the firm's average financial leverage over the period rather than the current leverage.
- Requires data
Determinants of Beta
- Business risk
- Asset/Industry Beta
- Nature of product/service offered and operational leverage
- Financial risk
- Leverage
Beta and Leverage
$\beta_{Equity}=(1+(\frac{D}{E}*(1-T_C))\beta_{Asset}$Note: Assumes riskless debt i.e., debt has a beta of zero.
Ideal Beta (for valuation)
- Start with beta of the business that firm is in
- Adjust business beta for operating leverage
- Use the financial leverage of the firm to estimate the equity beta for the firm
Bottom Up Beta
- Unlever comparable industry peer betas (i.e., compute asset betas)
- Average them, to get an estimate of the industry (asset) beta
- Lever the average industry beta to the firm's (optimal) capital structure
Why Bottom Up?
- Lower Standard error
- Adjusted to reflect changes in business and financial risk
- Does not require historical stock prices
Conglomerates
- Can calculate an asset beta for each business sector
- Weight each asset beta by market value
- Issue is market value unknown
- Ideally you would estimate
- Alternatives are to use revenue or operating income
Market (Equity) Risk Premium
- Analysts(lack of) consensus: 1-10%
- 6.5% – 8.5% most common
- 1926 – 2005 period, large U.S. stocks averaged 8.5% higher returns than T-bills
- Damodaran to the rescue
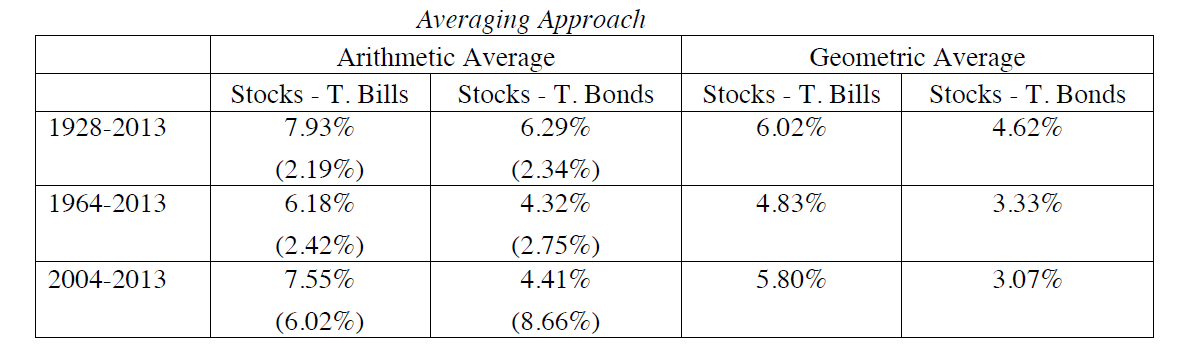
Historical ERP
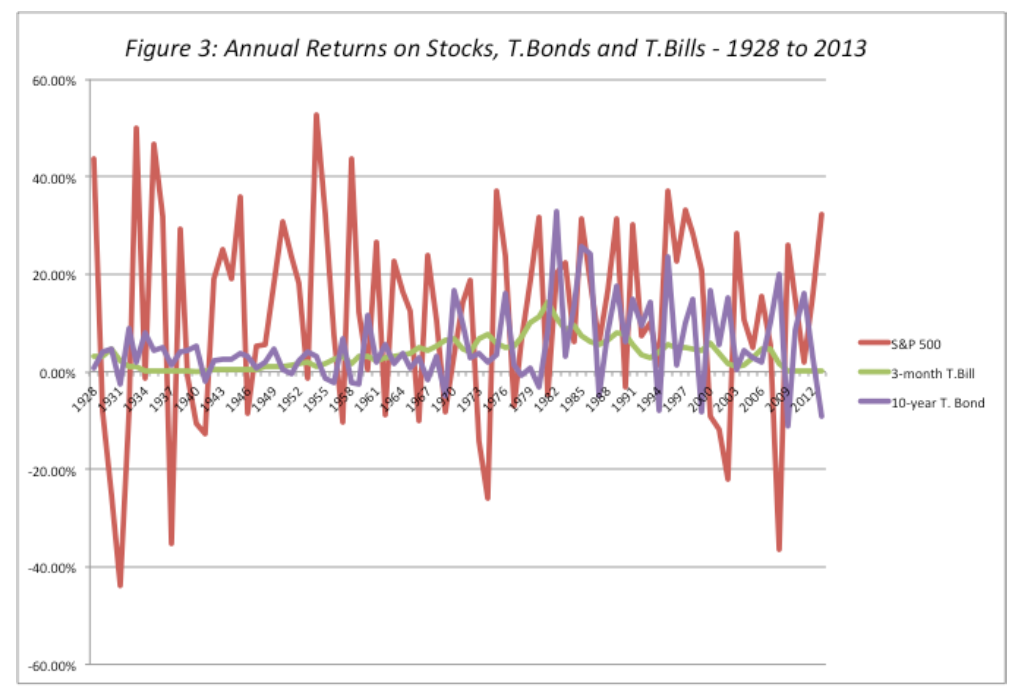
Averaging
Let's practice!
- Calculate Stryker(SYK) Beta (using historical prices)
- Using CAPM What is Stryker's Cost of equity?
- Using Cardinal Health (CAH), Medtronic (MDT), Abbott Laboratories (ABT) and Boston Scientific (BSX) calculate the bottom up beta. Assume a tax rate of 21%.
Forecast vs Terminal Window
- Can use different rates
- Standard for terminal rate to be lower
- Lower because slowed growth and (presumably) lower risk
- Possible assumption: Industry average beta (lower)
Enterprise Value
- We've valued FCFF at the cost of capital to the firm
- Enterprise value is FIRM value
- Equity Value=Enterprise Value - Net Debt
- Net Debt= Debt-Cash
- Also need to remove preferred stock and non-controlling interest
Revisit Gentex
Revisit Alaska Airlines