Relative Valuation: Multiples
Created by David Moore, PhD
Reference Material: Wall Street Prep Trading Comps and Transaction CompsKey Concepts
- Relative Valuation Intuition
- Trading Comps Steps
- Selecting Comps
- Common Multiples
- Last-Twelve Months vs Forward
- Application
- Transaction Comps
- Excess Cash
Relative Valuation
- Most asset valuations are relative
- Most equity valuations on Wall Street are relative valuations (approx. 85% of equity research)
- DCF valuations are often influenced by multiples
- Terminal value is often calculated using multiples
Relative valuation is pricing not valuation.
Why Relative?
- More likely to reflect market perceptions and moods
- Will always lead to significant number of securities that are undervalued or overvalued
- Tailors to portfolio managers (evaluation is relative)
- Require much less information
What is a multiple?
$Multiple=\frac{\text{What you are paying for an asset}}{\text{What you are getting in return}}$
- Numerator: MV of Equity or Enterprise Value
- Denominator
- Revenues or Drivers
- Earnings
- Cash flow
- Book Value
Three Multiple Checks
- Define the multiple
- Describe the multiple
- Apply the multiple
Define the Multiple
- Value and standardizing variable must be to same claimholder
- Multiple must be uniformly estimated for comparable assets
Example:Price to earnings
- Price: Current or average?
- EPS: Most recent, trailing 12 month, forecast
Describe the Multiple
- Average and standard deviation
- Median: can be more reliable depending on sample size and outliers
- How to deal with outliers?
- Throw out? Does this bias estimate?
- Multiples have skewed distributions
Apply the multiple
- What is a comparable firm?
- Same risk, growth, and cash flow characteristics
- Sampling trade-off:
- Small sample that are "just like you"
- Large sample that are "mostly kinda like you"
- Conclude stock is under or over valued relative to comparable group.
Market Assumption
Relative Valuation Steps
- Select comparable companies
- Pick which multiples you will use
- Pick timeframe (LTM vs forward)
- Select distributional statistics
- Apply statistic to corresponding metric to arrive at a value
Selecting comparables
- Ideally want to match on value drivers
- Almost always will be comparing apples to oranges
- Sources:
- Equity research
- 10-K
- SIC code screens
- Mergent (other financial website)
- Given list of possible comps, narrow based on nature of business and growth prospects (value drivers)
Common Multiples
- Equity Multiples
- P/E ratio
- PEG ratio
- Price to book Ratio
- Enterprise Multiples
- EV/EBIT
- EV/EBITDA
- EV/Revenue
P/E Ratio
$P/E=\frac{Share Price}{EPS}=\frac{Equity Value}{Net Income}$- Issues:
- Requires similar capital structure
- Relies on accounting profits
- Value drivers:
- PE=f(Payout Ratio, g, cost of equity)
PEG Ratio
$PEG=\frac{PE ratio}{g}$- Issues:
- Does not actually solve for g issue
- Relationship is non-linear
- Value drivers:
- PEG=f(Payout Ratio, g, cost of equity)
Price to book Ratio
$P/BV=\frac{Equity Value}{Book Value of Equity}$- Issues:
- BV can be negative
- Still a historical cost
- Value drivers:
- Price to Book=f(ROE, g, cost of equity, payout ratio)
EV/EBIT
$=\frac{Enterprise Value}{EBIT}$- Removes leverage
- Value drivers:
- EV/EBIT=f(rate of reinvestment, g, WACC, t)
EV/EBITDA
$=\frac{Enterprise Value}{EBITDA}$- Removes leverage
- Useful if D&A is large
- Value drivers:
- EV/EBITDA=f(rate of reinvestment, g, WACC, t, DA)
EV/Sales
$=\frac{Enterprise Value}{Sales}$- Assumes comparable cost structure
- Useful for negative earnings companies
- Value drivers:
- EV/Sales=f(after-tax operating margin,rate of reinvestment, g, WACC)
Other multiples
- EV/monthly subscribers
- EV/website hits
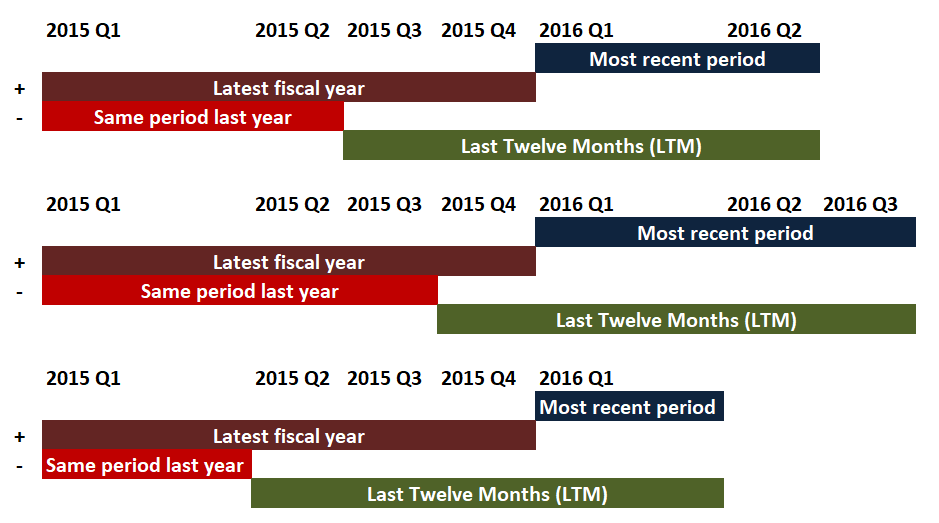
Period of Measurement
- Need to measure denominator
- Two common periods:
- Last (trailing) twelve months
- Forward looking (estimate next year)
Last Twelve Months (LTM)
Practice
LTM Practice
Find the LTM Sales, EBIT, and Net Debt for Microsoft (MSFT), Best Buy (BBY) , and Walt-Disney (DIS)
Select Statistic
- Most common is to use average
- Why might average be misleading?
- Median reduces impact of outliers
- Important to view/analyze the distribution
Example 1: Apply the Multiple
Go Nuts trades at $30 a share and has 30 million shares outstanding. They had revenue of $1 billion, EBITDA of $200 million, Net income of $75 million and Net Debt of $200 million What is Go Nuts implied share price under each multiple? Are they overvalued/undervalued? What are the ratios for Go Nuts?
| Peer Firm | EV/Sales | EV/EBITDA | P/E |
|---|---|---|---|
| Blue Star | 1.0x | 6.0x | 15.0x |
| Voodoo | 2.0x | 8.0x | 19.0x |
| Randy's | 1.5x | 6.5x | 17.0x |
| Donut Man | 1.0x | 5.8x | 14.6x |
| Average | 1.4x | 6.6x | 16.4x |
Example 1: Solution
| EV/Sales | EV/EBITDA | P/E | |
|---|---|---|---|
| Average (from Peers) | 1.4x | 6.6x | 16.4x |
| Enterprise Value | 1.4x1000=1400 | 6.6x200=1320 | N/A |
| Equity Value | 1400-200=1200 | 1320-200=1120 | 16.4*75=1230 |
| Share Price | 1200/30=40 | 1120/30=37.3 | 1230/30=41 |
| Overvalued | No (30<40) | No (30<37.3) | No (30<41) |
| Go Nuts Ratio | 1100/1000=1.1x | 1100/200=5.5x | 900/75=12x |
Transaction Comps
- Transaction Value/ Target EBITDA
- TV/ Target Revenue
- TV/ Target EBIT
- Offer Price per share/ Target EPS
- Offer value/Target NI
TV is EV and Offer Value is Equity Value in M&A context
Transaction Comps Example
Your company has revenue of $20B, EBITDA of $6.5B, Net income of $5B, and net debt of $1B. There are currently 1B shares outstanding and the current stock price is $50. Given the information below what is the implied share price under each transaction comparable?
| Transaction | TV/Revenue | TV/EBITDA | Offer Price/EPS |
|---|---|---|---|
| A | 2.00 | 8.00 | 16.00 |
| B | 3.00 | 12.00 | 20.00 |
| C | 1.50 | 11.00 | 16.00 |
| D | 2.50 | 13.00 | 18.00 |
| Mean | 2.25 | 11.00 | 17.50 |
Solution
| TV/Revenue | TV/EBITDA | Offer Price/EPS | |
|---|---|---|---|
| Mean | 2.25 | 11.00 | 17.50 |
| TV | 2.25*20=45 | 11*6.5=71.5 | N/A |
| Offer Value | 45-1=44 | 71.5-1=70.50 | 17.5*5=87.5 |
| Offer Price | 44/1=44 | 70.5/1=70.50 | 87.5/1=87.5 |
| Overvalued? | Yes (50>44) | No (50<70.5) | No (50<87.5) |
Excess Cash
- Use peer average Cash as a % of Total Assets as proxy for expected cash
- Excess cash is then the Max of Cash-Expected Cash and zero
Excess Cash Example
Your firm has cash holdings of $29.5M and Total assets of $800M. You calculate that the average Cash as a % of TA for your peer firms is 8.9%. What is the level of excess cash for your firm?=MAX(29.5-(800*.089),0)=0
What if Total Assets were $300M?
=MAX(29.5-(300*.089),0)=2.8