Working with Financial Statements
Chapter 3
Created by David Moore, PhD
Key Concepts
- Financial ratios
- Dupont Identity
- Benchmarking
- Issues with analyzing financial statements
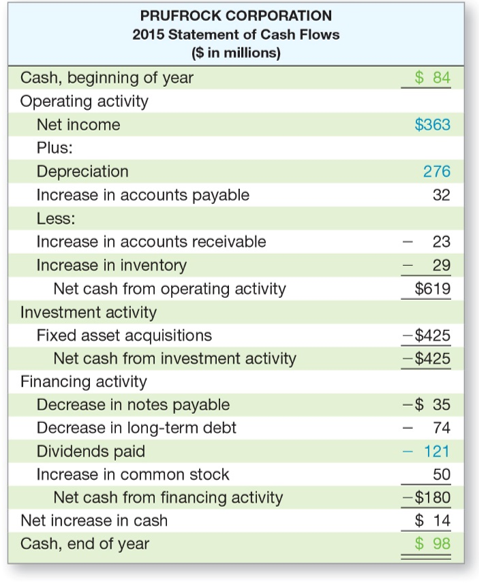
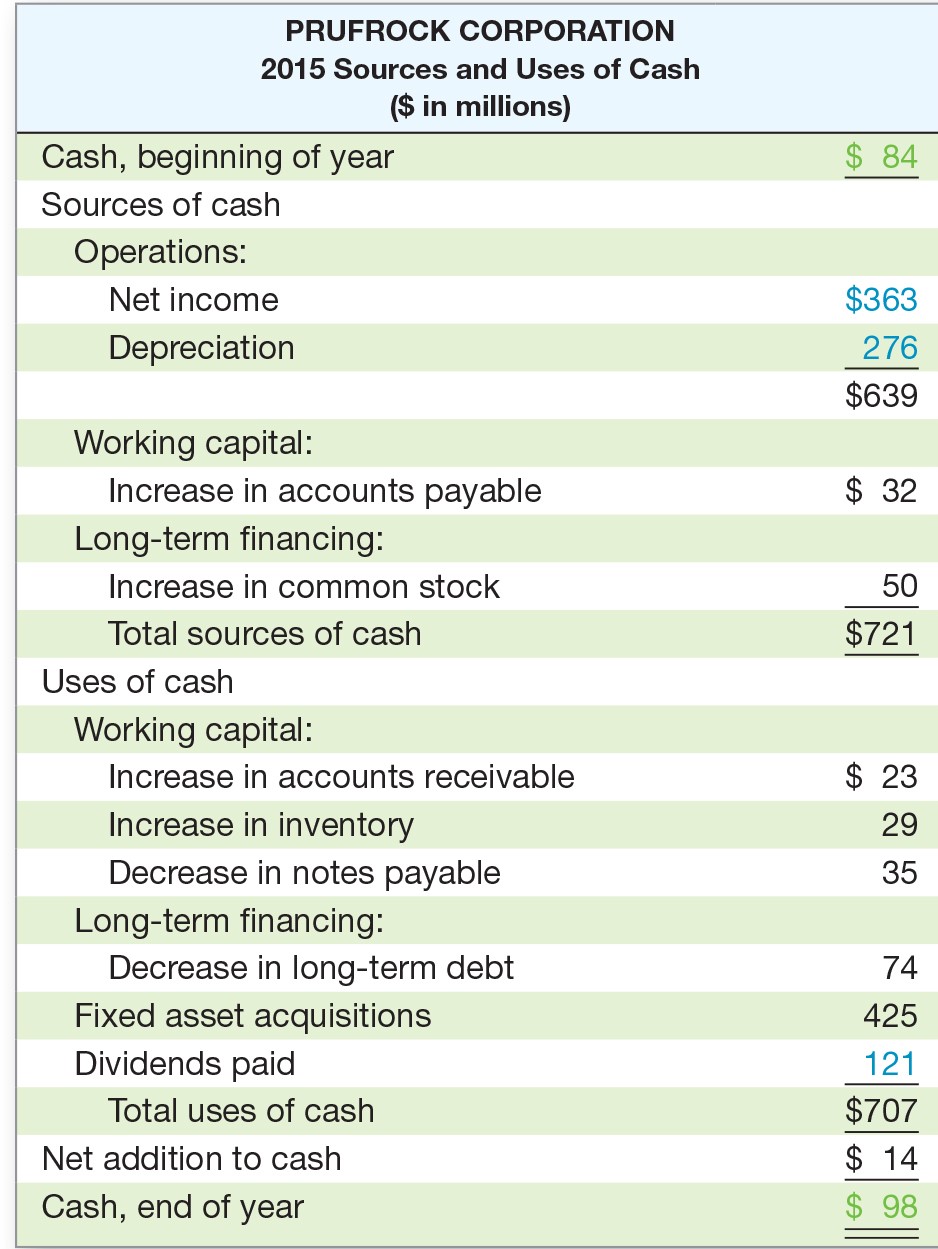
Statement of Cash Flows
Ratio Analysis
Overview
- Why study ratios?
- There are a lot of financial ratios; CFA exam has 40!
- We will cover commonly used ratios
- Not all ratios created from same data, i.e., be careful!
Takeaway: It is trivial to calculate ratios, I want you to
Ratio Types
- Liquidity or Short-term solvency
- Asset Management or Turnover
- Financial leverage or Long-term Solvency
- Performance (Profitability and Market Value)
Click here for a full list and description of financial ratios.
Short-term solvency
$Current Ratio=\frac{Current Assets}{Current Liabilities}$
$Quick Ratio=\frac{Current Assets - Inventory}{Current Liabilities}$
$Cash Ratio=\frac{Cash}{Current Liabilities}$
Asset Management
$Inventory Turnover=\frac{Cost of Goods Sold}{Inventory}$
Long-term Solvency
$Total Debt Ratio=\frac{Total Assets - Total Equity}{Total Assets}$
$Debt\text{-}Equity Ratio=\frac{Total Debt}{Total Equity}$
$Equity Multiplier=\frac{Total Assets}{Total Equity}$
$Cash Coverage Ratio=\frac{EBIT + Depreciation}{Interest}$
Sidenote: Typically analysts are only concerned with long-term debt.
Performance: Profitability
$Profit Margin=\frac{Net Income}{Sales}$
$Return on Equity(ROE)=\frac{Net Income}{Total Equity}$
$Return on Assets(ROA)=\frac{Net Income}{Total Assets}$
Performance: Market
$Earnings Per Share=\frac{Net Income}{Shares Outstanding}$
$PE Ratio=\frac{Price Per Share}{Earnings Per Share}$
$Market\text{-}To\text{-}Book Ratio=\frac{Market Value}{Book Value}$
Enterprise value
$Enterprise Value=Market Cap + Book Value Of Liabilities - Cash$
Examples

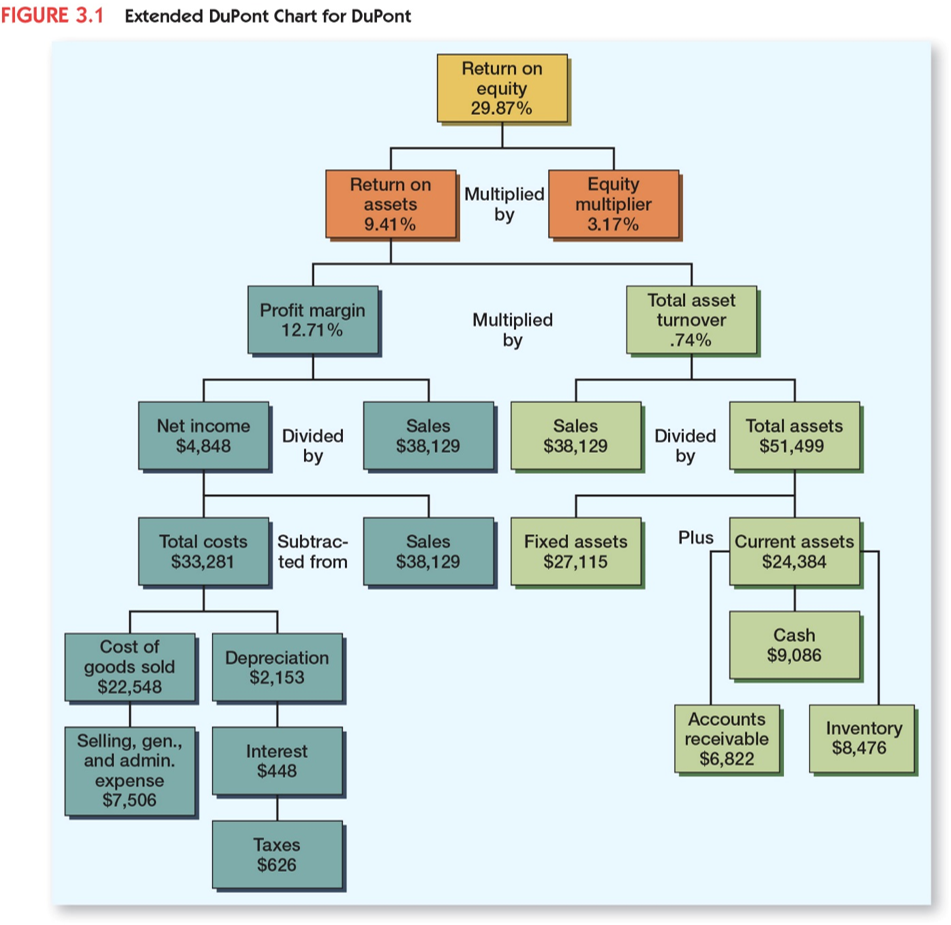
Dupont Identity
$ROE=Profit Margin \text{ x } Total Asset Turnover \text{ x } Equity Multiplier$
Why analyze financial statements?
- Market data can be difficult to get
- Comparison tool: Internal vs external uses
Benchmarking
Ratio in isolation does not paint entire picture, therefore; compare to "something". Benchmarking is finding that something.
Common Benchmarks
- Time trend analysis
- Peer group analysis
SIC Codes

Issues/Concern with Financial Statements Analysis
- No theory
- Conglomerates
- Globalization
- Different accounting procedures
- Fiscal-year ends and seasonality
Key Learning Outcomes
- Financial Ratios!!! Calculate and
interpret. - Dupont Identity
- Benchmarking
- Issues with financial statements